Personal recommendations
Screens describe funds in general terms. Mapping a fund onto any reader's income, horizon or risk tolerance is advisory work, and no article on this site performs it.
The working process our articles follow when they screen and compare exchange-traded funds — stated step by step, so every published table can be argued with.
Most “AI in investment” content stops at the adjective. It names the technology and skips the arithmetic. These pages do the opposite: each article takes one screening or comparison question — how two similar equity ETFs differ, what a factor screen really ranks, where document parsing earns its keep — and shows the workflow that produced the answer.
The steps below are the standing recipe. Individual pieces deviate when the subject demands it, and the deviation is printed inside the piece.
Start by fixing what counts as comparable: region, asset class, index family, and the replication method (physical or synthetic). A screen that mixes these produces confident nonsense.
Public sources: exchange listings and issuer product pages.Pull the publicly reported numbers a comparison needs — net asset value history, total expense ratio, assets under management, daily traded value, bid-ask spread and the full holdings file for every fund in the universe.
Public sources: issuer factsheets, exchange data pages, fund filings.This is where the AI enters first. Text-analysis routines read prospectuses and factsheets, extracting index-construction rules, securities-lending terms and dividend treatment — clauses that change what a number means, and that a ratio table never shows.
Inputs: the filings themselves; flagged passages then get a human editorial read.Cost screens (expense ratio plus spread), tracking screens (difference and error against the stated index) and liquidity screens (traded value and assets) rank each fund within its universe — soft ranks, printed openly, never verdicts.
Similarity routines group funds by holdings overlap and factor profile rather than by marketing label. This is how two “different” products turn out to be one portfolio in two wrappers — and one genuine alternative appears where none was advertised.
Tables are built under identical criteria for every fund in the cluster, uncertainties are labelled as such, and the checklist that produced them is appended to the finished piece.
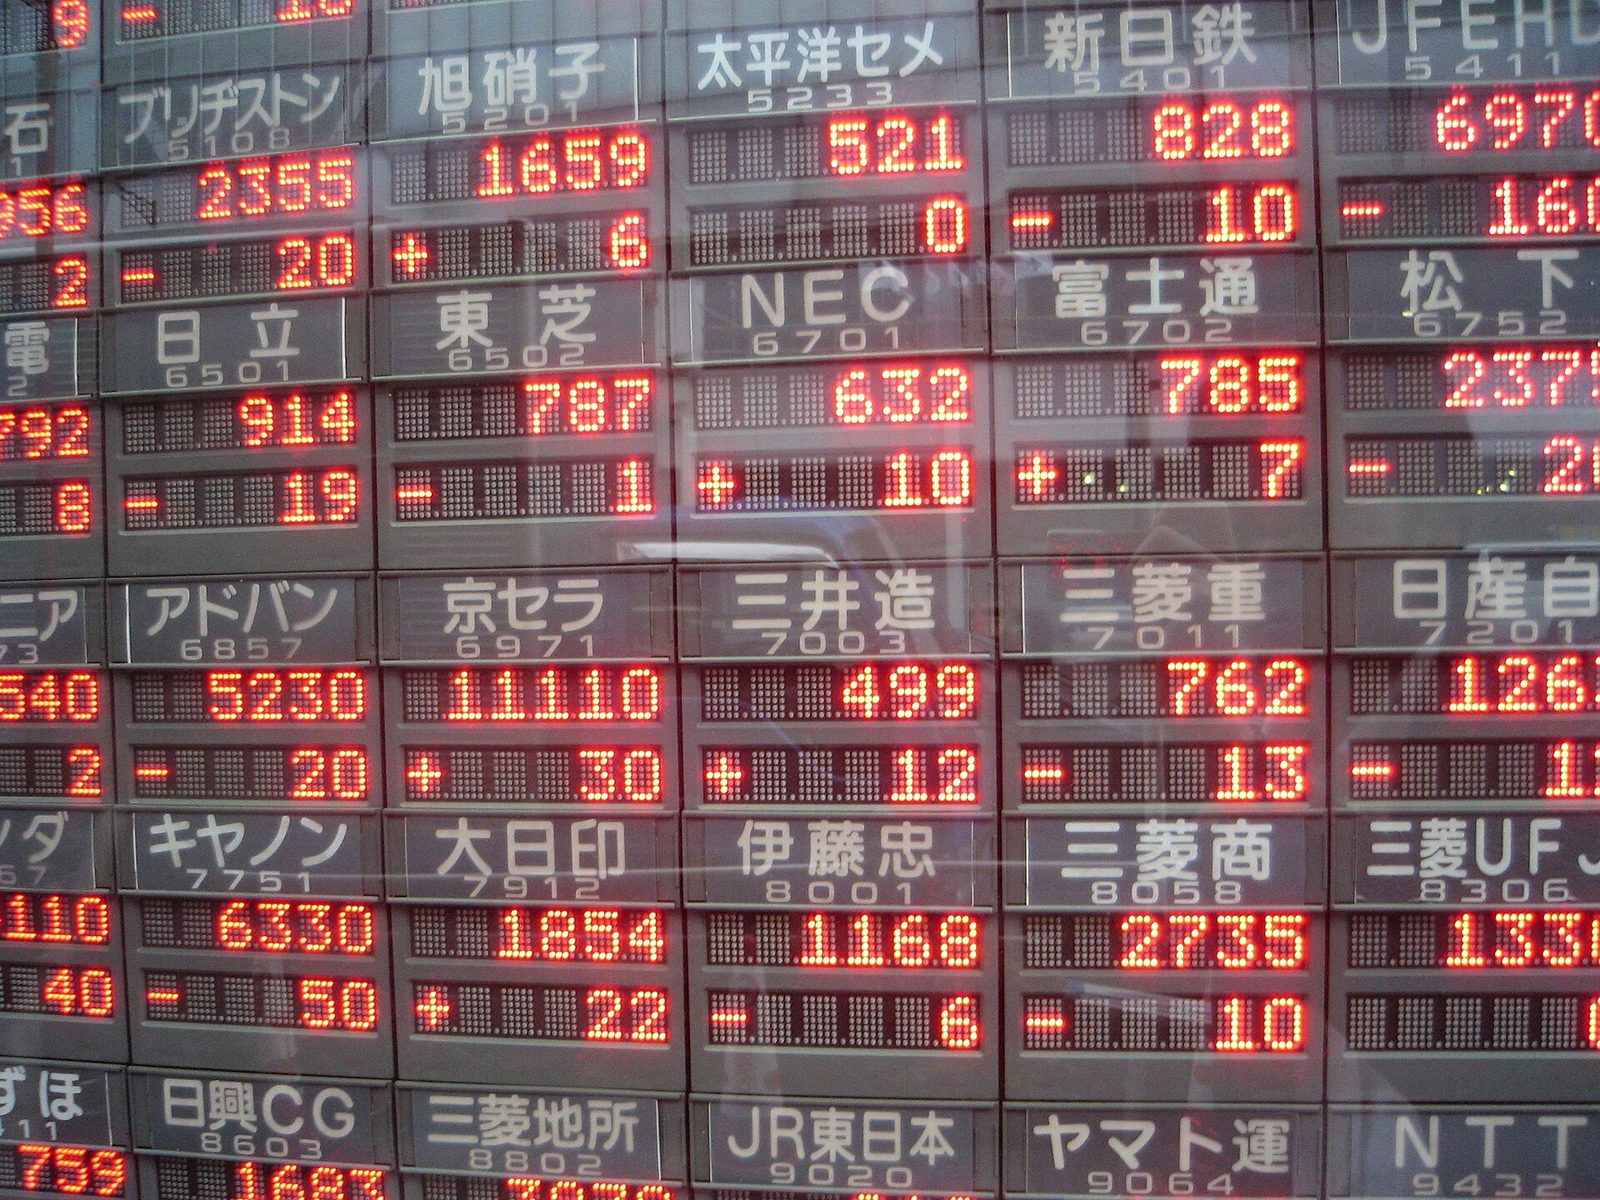
Quotes on a public board, photographed in Tokyo: the same class of public market data the screening steps draw on. Photo: nappa, CC BY 2.0, via Wikimedia Commons.
Three exclusions are structural, not incidental.
Screens describe funds in general terms. Mapping a fund onto any reader's income, horizon or risk tolerance is advisory work, and no article on this site performs it.
There is no brokerage function here, no deposits are taken, and nothing links from these articles to an order form. The site publishes text; readers act elsewhere, if at all.
No article asserts a win rate for a screen. Where a method is probabilistic, the piece says what it can and cannot establish, and stops there.
Ask about a step in the method or write to info@falconchannel.digital